
Climate and Happiness
- jmlane8
- Apr 2, 2021
- 20 min read
How Latitude, Precipitation, and Elevation are Related to Happiness
By J. M. Lane
Abstract
Climate can have a profound effect on mood and mental health. This connection has many components that scholars have attempted to calculate. The difficulty of measuring this relationship is due to the abstract nature of happiness. Philosophers since the ancient Greeks have struggled to characterize the nature of this term. The United Nations Sustainable Development Solutions Network created the World Happiness Index in 2012 in an attempt to quantify the idea. There are many factors that can impact happiness both on a local and international scale and climate can be a major force in the achievement of psychological well-being. The purpose of this study is to define the relationship between climate and happiness in a way that is quantifiable. Three climate factors (latitude, precipitation, and elevation) were included in the multivariate regression analysis. Results show a significant relationship between happiness and the climate factors included within this study.
Introduction
Happiness is a hard term to define due to the subjective nature of the word. For this reason, many scholars avoid the discussion of happiness and climate and focus primarily on mental health. The vast majority of this literature looks at the future of mental health and its relationship with climate change (Berry, 2009; Berry et al., 2010; Bourque and Willox, 2014; Doherty and Clayton, 2011; Swim et al., 2011). The defining attribute of current research is how a changing climate may affect psychological well-being, but what is well-being? According to Aristotle, (translated by J. E. C. Welldon, 1943), “the masses and the cultured classes agree in calling it [highest of all practical good] happiness, and conceive the ‘to live well’ or ‘to do well’ is the same thing as ‘to be happy.’ But as to what happiness is they do not agree” (p. 89).
The question of happiness has plagued scholars for centuries. The duality of happiness and psychological well-being are often seen as subjective words without a positivist existence. Both terms, therefore, are difficult to quantify (Ryff, 1989). Beginning in 2012, the United Nations (UN) commissioned the Sustainable Develop-ment Solutions Network to write and publish a report outlining world happiness. Part of this annual report was the development of an index that can translate the subjectivity of happiness into a quantifiable formula. The report uses survey data taken from 156 countries worldwide to determine the overall well-being and happiness of a country (Helliwell, 2017). To this day, there has been no research published using the World Happiness Index as a variable in the study of climate variability and psychological well-being.
Few research has looked at the relationship between climate factors and happiness due to the difficult manner of quantifying the concept of happiness. The purpose of this paper is to research the entrenched relationship between latitude, precipitation, elevation, and national happiness. This is achieved through the use of stepwise multivariate regression to discover the type of relationship and to what extent that one exists. After the completion of this analysis, all data available was mapped on a global scale.
Climate and Health
Climate has a unique effect on health and physical well-being. The link between mortality and temperature is apparent when looking at the fluctuations between summer heatwaves and winter deep freezes. Over the past forty years, scholars have focused on the relationship between seasonal temperature extremes, extreme weather, rise of infectious disease, and mortality (Epstein, 1999). According to Bull and Morton (1978), there is a direct relationship between mortality rates in the elderly and temperatures. This study determined that there is a causal relationship as well.
Traditional research has focused on extreme events such as heat-waves and deep-freezes on mortality (Christidis, et al., 2015; Bull and Morton, 1978). Scale is an important factor in any study and can help determine the applicability of the conclusions. Some studies develop research methodology using national databases while others take samples at the neighborhood level. Kinenberg (2002) looked at the Chicago heat-wave of 1995 and concluded that a number of neighborhoods had increased mortality rates.
By focusing on extreme events, these studies may ignore the effects of moderate changes in climate on health. Other scholars have used longitudinal case-studies to determine that sun and ambient heat exposure can complicate cardiovascular conditions and negatively affect individuals with respiratory disease. The risks are especially high for the economically disadvantaged, elderly, and infants (Basu and Samet, 2002).
While extreme heat has been the focus of a large number of publications, there have been several studies showing a relationship between cold temperatures and health (Alberdi, et al., 1998; Keatinge, and Donaldson, 1995; Keatinge, and Donaldson, 1997; Kunst, at al., 1993). Alberdi, et al. (1998) focused specifically on mortality in a specific community in Madrid. This study found that high temperatures had almost no effect on mortality when the humidity level was high. This inverse relationship was contrary to earlier suggestions. The most significant results showed an increase in infectious disease during the cold winter months.
Other scholars have looked the impact of cold temperatures at the national scale. In a study focusing on climate in the Netherlands, results showed that cold temperature is not a direct cause of an increase in mortality rates. In this case, mortality rates and influenza cases are exacerbated by a combination of cold temperatures and increased wind (Kunst, et al., 1993). Results from a study in the United Kingdom were similar in scope. A rise of heart disease coincides with extreme cold and is increased when accounting for a lack of insulation in housing (Keatinge, and Donaldson, 1995). These studies provide a valuable resource for interpreting the impact of temperature and water vapor on mortality and heart health at differing scales and locations.
Natural Disasters and Health
Extreme weather can also be associated with increased mortality rates. This is especially true for flooding. Scholars have studied the impacts of flooding on death rates in developing countries but due to limited data, there still remains methodological problems for developing accurate results (Few, et al., 2004). Due to the lack of information on developing countries, a vast number of studies have focused on the United States. Greenough, et al., (2001) argued that even though the information is available, scholars should focus on creating accurate weather and climate modelling so as to prevent future health impacts. According to McMichael, et al., (2006), improved modelling and accurate detection should be incorporated into public policy measures to as to reduce the adverse effect of natural disasters and weather extremes on health.
Natural disasters such as floods, hurricanes, and cyclones can cause extreme devastation as well as complications in the health of adjacent communities. Scholars have focused on the health effects of flooding due to its high rate of occurrence (Ahern, et al., 2005). While the data is limited, some scholars have been able to study developing countries (Kunii, et al., 2002; Woodruff, et al., 1990; Yusof, et al, 1991). Relatively reliable data has allowed a number of studies to compare mortality rates to flooding in developed countries (Abrahams, et al., 1976; Bennett, 1970; Dietz, et al., 1990; Duclos, et al., 1991; French, et al., 1983; Handmer and Smith, 1983).
A common method for determining causality between flooding and health problems is the use of interviews. Some scholars use a combination of interviews and data provided by local clinics. Results from interviews and hospital data showed that the number of malaria incidents in Mozambique increased by as much as a factor of 1.5 (Kondo, et al., 2002). After a major flood in Bangladesh in 1998, fever accounted for the largest percentage of health-related problems and diarrhea came in a close second (Kunii, et el. 2002). A similar study surveyed four groups of people before, during, and after a flood in Eastern India near the Bay of Bengal. Results showed a significant increase in number of cases of diarrhea and respiratory disease after the flood (Biswas, 1999). Another study surmised that illnesses caused by diarrheal disease outpaced other illness incidences in Khartoum, Sudan shortly after a flood (Woodruff, 1990).
Scholars have suggested the development of sound planning and infrastructure so as to reduce the impact of natural disasters on health. The creation of appropriate education programs and early warning systems in cities across the country has been recommended as well (Few, et al., 2004). Other scholars have suggested that research should continue to look at the long-term effects of natural disasters so as to promote continued improvement in both physical and mental health (Ahern, et al., 2005). Others have provided valuable acumen into the reality of natural disasters and human ailments. Future research should continue to focus on potential adaptations to natural disasters and the development of disaster mitigating infrastructure.
Climate and Mental Health
Growing focus on the relationship between extreme temperatures, a lack of sunlight, and mental health has become a major subfield in psychiatry. There have been a growing number of season affective disorder diagnoses in recent decades, leading to the development of specific treatment designed to reduce depression arising from seasonal extremes (Lurie, et al., 2006). A growing number of scholars are also focusing on the impact of seasonal changes on depression, with many concluding that the number of depressive episodes peaking in the spring and autumn months (Dominiak, et al., 2015; Geoffroy, et al., 2014; Parker and Graham, 2016; Volpe and Del Porto, 2006). Others have researched the link between seasonal changes and suicides (Christodoulou, et al., 2012; Coimbra, et al., 2016).
Climatic impacts on mood have been studied such as the average temperature, amount of daily sunlight, and wind (Denissen, et al., 2008; Huibers, et al., 2010). Extreme temperature has a profound effect on the number of emergency room visits, as presented earlier. Several scholars have used similar methodologies to determine a link between the number of psychiatric visits on extremely hot days (Hansen, et al., 2008; Vaneckova and Bambrick, 2013; Wang, et al., 2014).
Some scholars have found a link between humidity and emergency room visits (Garcia, et al., 2009), however these results are inconsistent at different scales. According to Mawson and Smith (1981), there is an inverse relationship between humidity and admission into an emergency room for mania. This study focused on London and concluded that due to the complexity of psychology that there are more variables involved in psychiatric clinic admission totals than climatic factors, explaining the random distribution of values tested. Other scholars found that psychiatric hospital admission for nonviolent attacks had increased in extreme heat with low humidity and low air pressure (Talaei, et al., 2014).
A large number of publications have researched recent heat waves and possible links with violent behavior and psychiatric emergencies (Bulbena, et al., 2006; Bulbena, et al., 2009; Morali, et al., 2008). Others have focused on air pressure and increased violence. According to Schory, et al., (2003), there is a significant correlation between the number of reported violent attacks and the reduction of barometric pressure. While this inverse relationship of significant, the correlation was weak.
Natural Disasters and Mental Health
The burgeoning interest in extreme weather events such as typhoons, floods, and cyclones has led to an increased focus on mental disorders related to these events such as Post-Traumatic Stress Disorder (PTSD), depression, and aggressive behavior. A growing body of literature has concentrated on the impact of natural disasters on the mental health of developing countries due to the devastating impact of extreme weather events on these populations (Rataj and Garthus-Niegel, 2016).
PTSD has been reported in developing countries shortly after natural disasters and can be attributed to the loss of loved-ones. Shortly after hurricane Mitch in 1998, several individuals were given mental health screenings and it was determined that PTSD was especially prevalent in poverty-stricken areas with low education. Women were especially at risk for PTSD and showed the lowest improvement rates of those who were screened (Caldera, et al., 2001). Understanding the impact of inclement weather on PTSD, Huang, et al., (2010) created a model based on demographic patterns and weather anomalies to predict potential PTSD risks within flood districts in Hunan, China.
Natural disasters can have a profound impact on other psychological issues especially when the number of casualties is greater than expected. Another study found, “greater psychopathology can be expected if the victims are female, if there are many casualties, and if the cause of the disaster is of natural as opposed to human origin” (Rubonis and Bickman, 1991; p. 397). Amstadter, et al. (2009) interviewed 798 individuals shortly after Typhoon Xangsane hit the shores of Vietnam. Four separate psychological disorders were tested and results showed a significant increase in mental anguish, however, the rate of disorders were much lower than that of many Western countries.
Flooding has become a major concern for scholars due to its overall effect on lifestyle. Longitudinal studies are common when dealing with mental health and flooding. Results from a study in Iowa found that the depression rose slightly after a flood. This factor was exacerbated by income, finding that lower income populations had higher cases of depression due to the loss of living space or personal property. People living in villages and towns saw a higher rate of depression overall than those living in large urban areas and farms (Ginexi, et al., 2000). Longitudinal studies provide a valuable resource for understanding the nature of change during an extreme weather event. This is especially true if a control group from a related community is available. Scholars developed a study with these parameters in Puerto Rico and found that the number of cases of depression and PTSD significantly increased in groups exposed to the flood over those who were not (Canino, et al., 1990).
Flooding in the town of Lewes, England was associated with an increase in psychological depression due to physical stress received throughout the flood (Reacher, et.al., 2004). In another case study, two groups in South Korea were compared to see if there were any significant differences. One group was exposed to the flood, another avoided it. Results showed that the exposed group saw an increase in PTSD and anxiety whereas the control group did not (Chae, et al., 2005). Scholars have argued that there needs to be more research on the effects of flooding on mental health due to the rising number floods across the world. Geographical Information Systems (GIS) can go a long way to improve research within this area of study (Jackubicka, et al., 2010).
Research in the field of climate and psychology has focused largely on the immediate, and in some cases long-term, impact of natural disasters. Other have focused on single events or climate variables on a small-scale area. This paper takes into account worldwide and generalized climate characteristics and the relationship with happiness. These variables are generalized on a large scale, attempting to represent the population at large.
Methods
For the purpose of this study, 125 independently governed countries were included in the calculations (Figure 1). As of 2018, there are 195 countries around the world and 75 territories (The World Factbook, 2017). Due to limited data, not all countries and territories were included in this analysis. All data were collected from the following sources:
Central Intelligence Agency (CIA) – The World Factbook
The World Bank
Portland State University
United Nations (UN) Sustainable Development Solutions Network (SDSN)

Data were compiled to investigate the type of relationship that exists between happiness and climate. In order to evaluate countrywide happiness, the UN Happiness Index was included as the dependent variable. To properly assess climate factors, the following independent variables were included to create a robust description of aggregated climate by country: central latitude, average yearly temperature, and mean elevation (see list below). The valued performance of each model within a given set was evaluated using Akaike Information Criterion (AIC) (Crawley, 2015). At the current scale, the sample sizes were large enough and no null values were present so no adjustments were made to the AIC score. AIC scores were assembled in order of validity. Coefficient estimates and standard errors were compiled and compared to show the significance of each model. In order to measure the variance appropriately. R^2 values were included in this paper.
List of Included Independent and Dependent Variables
Independent Variables
Central Latitude
Average Yearly Precipitation
Mean Elevation
Dependent Variables
UN Happiness Index
The factors included in this study show an approximation of the average climate within each country of the study area. By using multivariate regression, the type of relationship that exists between the included variables and be defined and explained, providing possible forecasts in future research. The following formula was used within the analysis:
y=β_0+β_1 x_1+β_2 x_2+⋯β_(n-1) x_(i-1)+β_n x_i+Σ_i
where β_0=y-intercept,β_n=coefficient estimate slope for variable x_i
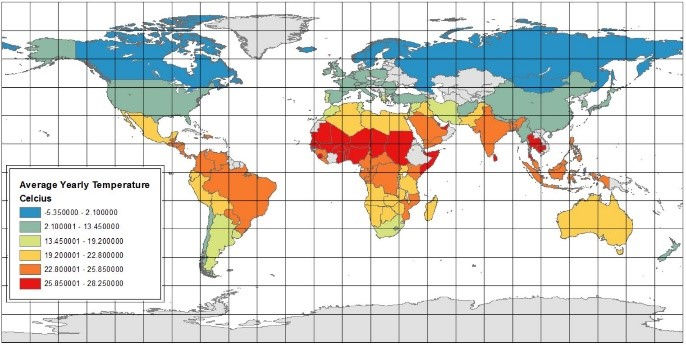
Variables included in this study are used to describe the general climate of each country and the general well-being of the citizenry as a whole. This data is generalized and may fall short of providing accurate measurements at differing scales. Future studies should take scale into account when using the data provided in this research. The central latitude was determined by placing a point at the centroid of the country’s geometry and measuring the latitude at that point (Portland State University, 2018). Latitude was included due to its relationship with temperature, keeping in mind that it is only a generalized variable that does not represent all latitudes across each country. Latitudinal numeric values were measured using absolute values by removing negative signs from locations south of the Equator. Average yearly temperature was mapped to give a visual representation of the link between elevation and temperature (Figure 2).
Average annual precipitation (AYP) is a long-term indicator of the average rainfall, snow, sleet, and/or hail that falls as precipitation within a country in a given year. This variable is determined by averaging the total values of yearly precipitation of the countries included between the years of 1962 and 2014. AYP is measured in millimeters (mm) per year (The World Bank, 2018). While this variable does not describe current conditions, it gives an approximate idea of the expected rainfall considering historical records. Average annual precipitation was mapped to give a generalized representation of global precipitation by country (Figure 3).

Mean elevation is determined by placing centroids evenly across the country overlay and measuring the elevation of those centroids. Elevations within a country’s border are then averaged, representing the mean elevation of that country (Portland State University, 2018). This variable was included to investigate a possibility relationship between altitudinal life zones and happiness. This variable is aggregated so it does not accurately represent elevation at different scales within a country.
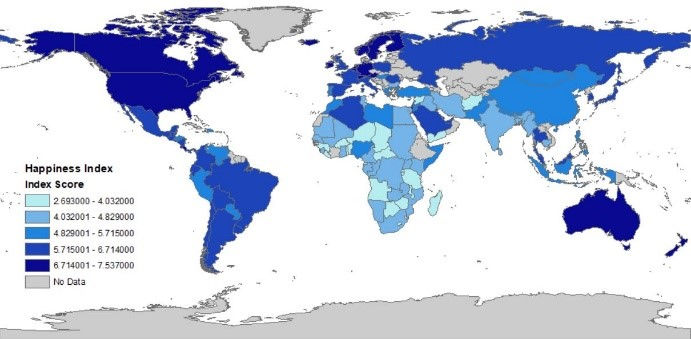
The World Happiness Index began in 2012 as an initiative by the United Nations (UN) Sustainable Development Solutions Network (SDSN) to represent development around the world in a different way. The Happiness Report was designed to promote the idea of well-being over that of economic growth. In order to calculate the index, a Gallup World Poll (GWP) is distributed to 156 different countries and approximately 1000 respondents are recorded each year. Respondents are asked a series of questions and rank their lives on a scale of 0 to 10. The answers are standardized into index form (Helliwell, 2017). The World Happiness Index was included because it is currently the only international measurement of happiness based on surveys. The World Happiness Index was compiled into a table, joined with a world map vector file, and shaded according to natural breaks using ArcMap GIS software (Figure 4).
Analysis/Discussion
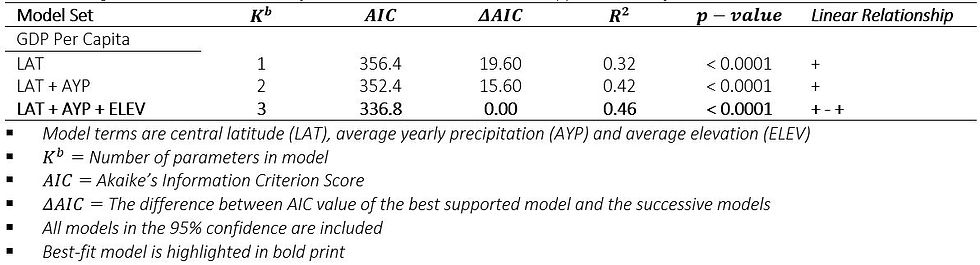
Model set results show a significant relationship between the three included climate factors (central latitude, average yearly precipitation, mean elevation) and the World Happiness Index. Significance was measured at a 95% confidence interval (α=0.05). Within the original multiple regression model, all independent variables had a significant p-value<0.05. The r-squared analysis explains 46% of the variance (R^2=0.46). The lowest AIC score used in determining the best-fit model was recorded as AIC=336.8. This score was lower than the next available AIC score by a 15.60 differentiation. The model that included all of the original variables was chosen as the best-fit model due to its low AIC score and the corresponding r-squared value (Table 1).
Table 1
Model Averaged Parameter Estimates of Three Climate Factors the UN Happiness Index, from 125 Countries.
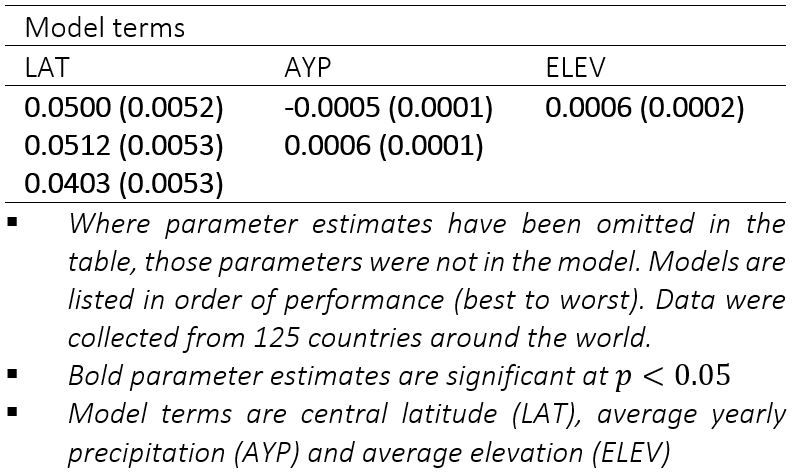
Coefficient estimates reveal an interesting contrast between variables (Central Latitude = 0.0500; Average Yearly Precipitation = -0.0005 Mean Elevation = 0.0006). The best-fit model included both positive and negative relationships between variables (Table 3). The coefficient estimates for latitude show a positive linear relationship; eluding to the conclusion that as a country’s latitude increases (further away from the equator), happiness increases. The remaining coefficient estimates are much smaller, showing relatively low slope. Average year precipitation is negative; as precipitation decreases, happiness increases. When elevation increases, so does happiness.
Table 2
Model Results for Three Climate Factors and the UN Happiness Index.
Results from the best-fit model show a significant relationship between the variables included. However, due to the slope of each variable, the resulting relationship only shows a slight increase for elevation and decrease for precipitation. Because the r-squared only explains 46% of variability, it should be concluded that there are other factors involved when determining happiness.
Conclusion
The best-fit model shows a significant relationship between climate and happiness; however, the relationship is weak due to the low slope of the model. The variables within the model are far too aggregated to be used at smaller scales, yet the results provide an interesting synopsis of the correlation between climate factors and mental well-being. The factors included are intended to show a generalized representation of climate on a large-scale and provide a quality starting point for future research.
The following is concluded from the research reviewed and the calculations provided within this analysis:
In most case studies there were significant increases in mortality rates during extreme heat. Some studies found an increase in mortality and physical ailments in extreme cold.
There is a significant rise in mortality during extreme weather events such as flooding and cyclones; the number of diarrhea and respiratory problems increase after flooding.
Several psychiatric disorders are associated with seasonal changes as well as extreme heat. A reduction in air pressure and heat waves are related to an increase in violent behavior.
Disorders such as PTSD and depression often coincide with extreme weather conditions such as typhoons, cyclones, and flooding in both developed and developing countries. These weather anomalies often have greater impacts on people with lower income and female populations.
There is a significant correlation between average annual precipitation, mean elevation, latitude, and happiness on an international scale.
The overarching conclusion drawn from the statistical analyses performed in this paper finds that as latitude increases, precipitation decreases, and elevation increases, the general happiness of a country increases. Conclusory data shows that while there is a significant relationship, happiness only increases slightly as the other variables progress in their respective directions. The connection between happiness and latitude might be more closely related to social policies between governments further away from the equator, but these results show an interesting link between the two variables. Happiness, an abstract idea, is difficult to define, making quantifiable conclusion troublesome to acquire. The concept of happiness and mental well-being is determined by an innumerable number of variables, making it virtually impossible to conclude that climate causes happiness. It can be deduced however, that climate does affect people emotionally. More research is needed to truly understand the relationship between climate and happiness, especially at a local scale.
References
Abrahams, M. J., Price, J., Whitlock, F. A., & Williams, G. (1976). The Brisbane floods, January 1974: their impact on health. The Medical Journal of Australia, 2(25-26), 936-939.
Ahern, M., Kovats, R. S., Wilkinson, P., Few, R., & Matthies, F. (2005). Global Health Impacts of Floods: Epidemiologic Evidence. Epidemiologic Reviews, 27(1), 36-46. doi:10.1093/epirev/mxi004
Alberdi, J. C., Díaz, J., Montero, J. C., & Mirón, I. (1998). Daily mortality in Madrid community 1986–1992: relationship with meteorological variables. European journal of epidemiology, 14(6), 571-578.
Amstadter, A. B., Acierno, R., Richardson, L. K., Kilpatrick, D. G., Gros, D. F., Gaboury, M. T., ... & Buoi, L. T. (2009). Post-typhoon prevalence of post-traumatic stress disorder, major depressive disorder, panic disorder, and generalized anxiety disorder in a Vietnamese sample. Journal of traumatic stress, 22(3), 180-188.
Aristotle. (1943). Nicomachean Ethics (W. J. Black, Ed.; J. E. Welldon, Trans.). Roslyn, NY: Walker J. Black, Inc.
Basu, R., & Samet, J. M. (2002). Relation between elevated ambient temperature and mortality: a review of the epidemiologic evidence. Epidemiologic reviews, 24(2), 190-202.
Basu, R., & Samet, J. M. (2002). Relation between elevated ambient temperature and mortality: a review of the epidemiologic evidence. Epidemiologic reviews, 24(2), 190-202.
Bennet, G. (1970). Bristol floods 1968. Controlled survey of effects on health of local community disaster. British medical journal, 3(5720), 454.
Berry, H. (2009). Pearl in the oyster: Climate change as a mental health opportunity. Australasian Psychiatry, 17, 453 – 456.
Berry, H.L., Bowen, K., & Kjellstrom, T. (2010). Climate change and mental health: A causal pathways framework. International Journal of Public Health, 55, 123 – 132.
Biswas, R., Pal, D., & Mukhopadhyay, S. P. (1999). A community based study on health impact of flood in a vulnerable district of West Bengal. Indian journal of public health, 43(2), 89-90.
Bourque, F., & Willox, A. C. (2014). Climate change: The next challenge for public mental health? International Review of Psychiatry, 26(4), 415-422. doi:10.3109/09540261.2014.925851
Bull, G. M., & Morton, J. (1978). Environment, Temperature and Death Rates. Age and Ageing, 7(4), 210-224. doi:10.1093/ageing/7.4.210
Caldera, Trinidad, et al. "Psychological impact of the hurricane Mitch in Nicaragua in a one-year perspective." Social psychiatry and psychiatric epidemiology 36.3 (2001): 108-114.
Canino, G., Bravo, M., Rubio-Stipec, M., & Woodbury, M. (1990). The impact of disaster on mental health: prospective and retrospective analyses. International Journal of Mental Health, 19(1), 51-69.
Canino, G., Bravo, M., Rubio-Stipec, M., & Woodbury, M. (1990). The impact of disaster on mental health: prospective and retrospective analyses. International Journal of Mental Health, 19(1), 51-69.
Chae, E. H., Kim, T. W., Rhee, S. J., & Henderson, T. D. (2005). The impact of flooding on the mental health of affected people in South Korea. Community Mental Health Journal, 41(6), 633-645.
Christidis, N., Jones, G. S., & Stott, P. A. (2015). Dramatically increasing chance of extremely hot summers since the 2003 European heatwave. Nature Climate Change, 5(1), 46.
Dietz, V. J., Rigau-Perez, J. G., Sanderson, L., Diaz, L., & Gunn, R. A. (1990). Health assessment of the 1985 flood disaster in Puerto Rico. Disasters, 14(2), 164-170.
Doherty, T., & Clayton, S. (2011). The psychological impacts of global climate change. American Psychologist, 66(4), 265 – 276.
Duclos, P., Vidonne, O., Beuf, P., Perray, P., & Stoebner, A. (1991). Flash flood disaster-nîmes, France, 1988. European Journal of Epidemiology, 7(4), 365-371.
Epstein, P. R. (n.d.). Climate and Health. Science, 285(5426), 347-348.
Few, R., Ahern, M., Matthies, F., & Kovats, S. (2004). Floods, health and climate change: a strategic review (Working paper No. 63). Tyndall Centre for Climate Change Research.
French, J., Ing, R., Von Allmen, S., & Wood, R. (1983). Mortality from flash floods: a review of National Weather Service reports, 1969-81. Public Health Reports, 98(6), 584.
Ginexi, E. M., Weihs, K., Simmens, S. J., & Hoyt, D. R. (2000). Natural disaster and depression: a prospective investigation of reactions to the 1993 midwest floods. American journal of community psychology, 28(4), 495-518.
Greenough, G., McGeehin, M., Bernard, S. M., Trtanj, J., Riad, J., & Engelberg, D. (2001). The potential impacts of climate variability and change on health impacts of extreme weather events in the United States. Environmental health perspectives, 109(2), 191-198.
Handmer, J. W., & Smith, D. I. (1983). Health hazards of floods: hospital admissions for Lismore. Geographical Research, 21(2), 221-230.
Helliwell, J., Layard, R., & Sachs, J. (Eds.). (2017). World Happiness Report 2017. New York, NY: UN Sustainable Development Solutions Network.
Huang, P., Tan, H., Liu, A., Feng, S., & Chen, M. (2010). Prediction of post-traumatic stress disorder among adults in flood district. BMC Public Health, 10(1), 207.
Jakubicka, T., Vos, F., Phalkey, R., Guha-Sapir, D., & Marx, M. (2010). Health impacts of floods in Europe: Data gaps and information needs from a spatial perspective. Centre for Research on the Epidemiology of Disasters (CRED).
Keatinge, W. R., & Donaldson, G. C. (1995). Cardiovascular mortality in winter. Arctic medical research, 54, 16-18.
Keatinge, W. R., & Donaldson, G. C. (1997). Cold exposure and winter mortality from ishaemic heart disease cerebrovascular disease respiratory disease and all causes in warm and cold regions of Europe. Lancet, 349(9062), 1341-6.
Klinenberg, E. (2015). Heat wave: A social autopsy of disaster in Chicago. University of Chicago Press.
Kondo, H., Seo, N., Yasuda, T., Hasizume, M., Koido, Y., Ninomiya, N., & Yamamoto, Y. (2002). Post-flood—infectious diseases in Mozambique. Prehospital and disaster medicine, 17(3), 126-133.
Kunii, O., Nakamura, S., Abdur, R., & Wakai, S. (2002). The impact on health and risk factors of the diarrhoea epidemics in the 1998 Bangladesh floods. Public health, 116(2), 68-74.
Kunst, A. E., Looman, C. W., & Mackenbach, J. P. (1993). Outdoor air temperature and mortality in the Netherlands: a time-series analysis. American Journal of epidemiology, 137(3), 331-341.
McMichael, A. J., Woodruff, R. E., & Hales, S. (2006). Climate change and human health: present and future risks. The Lancet, 367(9513), 859-869.
Rataj, E., Kunzweiler, K., & Garthus-Niegel, S. (2016). Extreme weather events in developing countries and related injuries and mental health disorders-a systematic review. BMC public health, 16(1), 1020.
Reacher, M., McKenzie, K., Lane, C., Nichols, T., Kedge, I., Iversen, A., ... & Simpson, J. (2004). Health impacts of flooding in Lewes: a comparison of reported gastrointestinal and other illness and mental health in flooded and non-flooded households. Communicable Disease and Public Health, 7(1), 39-46.
Rubonis, A. V., & Bickman, L. (1991). Psychological impairment in the wake of disaster: The disaster–psychopathology relationship. Psychological bulletin, 109(3), 384.
Ryff, C. D. (1989). Happiness is everything, or is it? Explorations on the meaning of psychological well-being. Journal of Personality and Social Psychology, 57(6), 1069-1081. doi:10.1037//0022-3514.57.6.1069
Swim, J. K., Stern, P. C., Doherty, T. J., Clayton, S., Reser, J. P., Weber, E. U., ... & Howard, G. S. (2011). Psychology's contributions to understanding and addressing global climate change. American psychologist, 66(4), 241.
Woodruff, B. A., Toole, M. J., Rodrigue, D. C., Brink, E. W., Mahgoub, E. S., AHMED, M. M., & Babikar, A. (1990). Disease surveillance and control after a flood: Khartoum, Sudan, 1988. Disasters, 14(2), 151-163.
Yusof, A., Siddique, A. K., Baqui, A. H., Eusof, A., & Zaman, K. (1991). 1988 floods in Bangladesh: pattern of illness and causes of death. Journal of diarrhoeal diseases research, 310-314.
The World Factbook. (2017). Washington, DC: Central Intelligence Agency, Retrieved February 19, 2018, from https://www.cia.gov/library/publications/the-world-factbook/index.html
The World Bank (2018). Average precipitation in depth (mm per year). Washington, DC: World Bank Group, Retrieved February 19, 2018, from https://data.worldbank.org/indicator/AG.LND.PRCP.MM
Portland State University (2018). Country Geography Data. Portland, OR: Portland State University, Retrieved March 15, 2018, from https://www.pdx.edu/econ/country-geography-data
Lurie SJ, Gawinski B, Pierce D, Rousseau SJ (2006) Seasonal affective disorder. Am Fam Physician 74(9):1521–1524
Dominiak M, Swiecicki L, Rybakowski J (2015) Psychiatric hospitalizations for affective disorders in Warsaw, Poland: effect of season and intensity of sunlight. Psychiatry Res 229(1–2):287–294. https://doi. org/10.1016/j.psychres.2015.07.011
Geoffroy PA, Bellivier F, Scott J, Etain B (2014) Seasonality and bipolar disorder: a systematic review, from admission rates to seasonality of symptoms. Journal of affective disorders 168:210–223. https://doi.org/10.1016/j. jad.2014.07.002
Parker GB, Graham RK (2016) Seasonal variations in rates of hospitalisation for mania and hypomania in psychiatric hospitals in NSW. Journal of affective disorders 191:289–291. https://doi.org/10.1016/j.jad. 2015.11.053
Volpe FM, Del Porto JA (2006) Seasonality of admissions for mania in a psychiatric hospital of Belo Horizonte, Brazil. Journal of affective disorders 94(1– 3):243–248. https://doi.org/10.1016/j.jad.2006.03.025
Denissen JJ, Butalid L, Penke L, van Aken MA (2008) The effects of weather on daily mood: a multilevel approach. Emotion 8(5):662– 667. https://doi.org/10.1037/a0013497
Huibers MJ, de Graaf LE, Peeters FP, Arntz A (2010) Does the weather make us sad? Meteorological determinants of mood and depression in the general population. Psychiatry Res 180(2–3):143–146. https:// doi.org/10.1016/j.psychres.2009.09.016
Hansen A, Bi P, Nitschke M, Ryan P, Pisaniello D, Tucker G (2008) The effect of heat waves on mental health in a temperate Australian city. Environ Health Perspect 116(10):1369–1375. https://doi.org/10. 1289/ehp.11339
Vaneckova, P., & Bambrick, H. (2013). Cause-specific hospital admissions on hot days in Sydney, Australia. PloS one, 8(2), e55459.
Wang, X., Lavigne, E., Ouellette-kuntz, H., & Chen, B. E. (2014). Acute impacts of extreme temperature exposure on emergency room admissions related to mental and behavior disorders in Toronto, Canada. Journal of affective disorders, 155, 154-161.
Mawson, D., & Smith, A. (1981). Relative humidity and manic admissions in the London area. The British Journal of Psychiatry, 138(2), 134-138.
García, F. M., Boada, S. S., Collsamata, A. X., Joaquim, I. G., Pérez, Y. A., Tricio, O. G., & Ibiza, C. M. (2009). Meteorological factors and psychiatric emergencies. Actas espanolas de psiquiatria, 37(1), 34-41.
Talaei, A., Hedjazi, A., Rezaei Ardani, A., Fayyazi Bordbar, M. R., & Talaei, A. (2014). The relationship between meteorological conditions and homicide, suicide, rage, and psychiatric hospitalization. Journal of forensic sciences, 59(5), 1397-1402.

Comments