
Wealth and Renewable Energy
- jmlane8
- Apr 3, 2021
- 24 min read
The Global and Local Impact of GDP on Renewable Energy
By J. M. Lane
Abstract
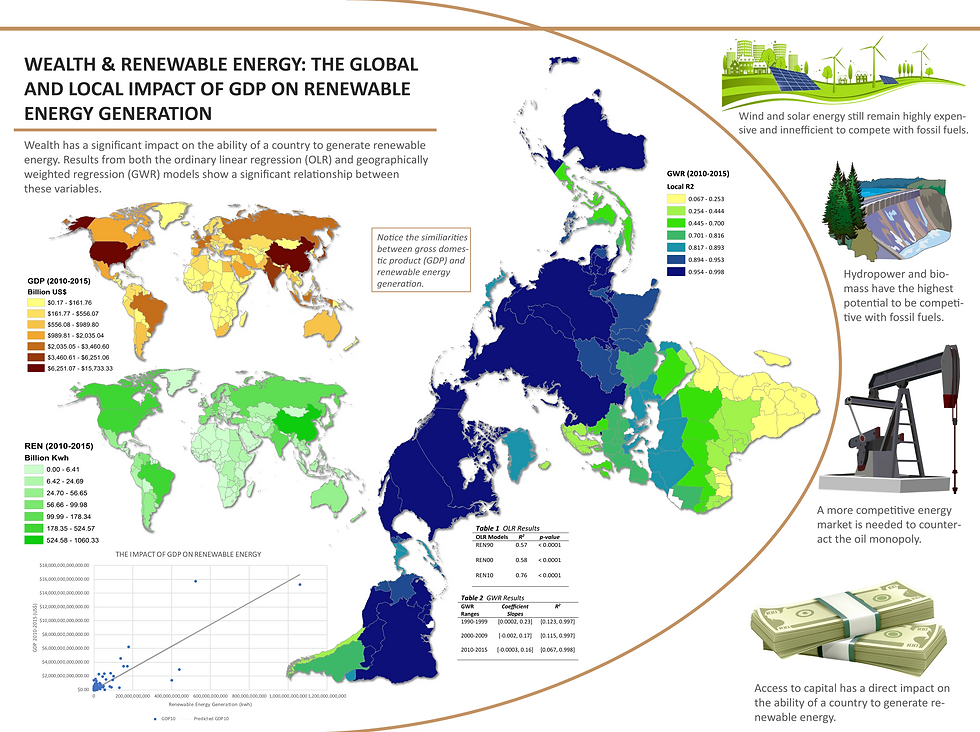
The economic viability of renewable energy has come to the forefront of research due to the rising concerns over carbon dioxide emissions. The purpose of this paper is to investigate the relationship between wealth and renewable energy. Empirical analyses were used to determine if gross domestic product (GDP) impacts renewable energy generation. Data were compiled and average over three-decade periods from 1990-2015. Two model sets were performed using ordinary linear regression (OLR) and geographically weighted regression (GWR). These results were compared to see which model set best explained the impact that GDP has on renewable energy generation and how this relationship has changed over three-decade periods. Results show that there is a significant relationship between these two variables for the 195 countries included in this study. The GWR model is a better tool for explaining the impact of GDP on renewable energy generation. Because GDP impacts renewable energy generation, policy initiatives should focus on increasing wealth in developing countries while also promoting diversification of renewable energy markets.
Introduction
Large scale production and consumption of renewable energy is due in large part to historical complications within the petroleum market. Because oil has monopolized the transportation and power industries throughout much of the twentieth century, many countries are adopting new forms of renewable energy in order to provide quality alternatives. The promotion of alternative forms of energy has also been expedited by increased environmental concerns (Owen, 2004). Renewable energy continues to be an important part of developing infrastructure that provides adequate electricity for a country at a relatively competitive price. In a petroleum dominated society, consumers are beholden to the rise and fall of oil prices. It is important to diversify the energy market so as to alleviate damage that consumers may encounter from a sharp rise in oil prices (Luft, 2013). The global community has an opportunity to promote real competition in the energy marketplace by improving access to new sources of power on a massive scale.
The success of a market economy depends on the ability of the marketplace to remain competitive and offer alternatives to dominant commodities. Rising and falling oil prices, along with supply scares, throughout the latter part of the twentieth century forced governments to rethink their approach to energy consumption and subsidization. The popular theory during this period was known as peak oil. According to Greene (1997), peak oil was short-sighted at best. Global oil supply remained high but oil producers created false scarcity to artificially increase prices in an attempt stifle their competition.
Unfortunately, oil price has a direct and sometimes harmful impact on the economy at large. Scholars contend that the slightest increase in oil prices can have an adverse effect on overall market prices, thereby reducing consumption on a large scale (Finn, 2000; Mork, 1989; Rotemberg & Woodford, 1996). Oil price shock is directly related to the cost of transportation. If the cost of transportation increases, commodity prices will rise in concert with transportation (Finn, 2000). This implies that the fate of an entire economy is in the hands of a few oil producing countries and transnational corporations.
In an attempt to promote competition, countries across the world have instituted market-oriented reforms. However, some scholars have argued that energy market liberalization has had only minor impacts. Empirical results from the European Union show policies falling short of desired effects (Fioro & Florio, 2013). Growing awareness of the environmental impact of burning fossil fuels and governmental subsidization of renewable energies have been the main drivers of innovation (Nesta, Vona, & Nicolli, 2014). Scholars have argued that innovation starts at the bottom through minor players in a larger market. These innovations often find it difficult to reach a larger consumer audience because the dominant market competitors use control mechanisms to quash competition (Klepper, 1996; Winter, 1984). Renewable energy is often adopted on a small scale and decentralized down to the community level. More specifically, wind turbines and solar panels are usually installed on individual properties and housing establishments (David & Wright, 2006; Lehtonene & Nye, 2009).
How can institutions promote the development of renewable energy and increase energy market competition? Sanyal and Ghosh (2014) argued that utility deregulation in the United States spurred competition, bringing in new green technologies. The rise of renewable energy production in the US has forced many private utility companies to rethink their business strategies, thereby adopting some of these new technologies to supplement current energy generation.
Many countries are taking a more holistic approach to the generation of electricity using renewable energy. “If reliance on fossil fuels is to be reduced, it is necessary to diversify the energy supply portfolio towards cleaner and more sustainable sources of energy, particularly renewable energy” (Timilsina, van Kooten, & Narbel, 2013; p. 642). Renewable energy use has grown to the point that, in some countries, alternative energy serves as the primary energy that is generated (Edenhofer, et al., 2013).
Scholars have argued that energy use is inexplicitly linked to economic growth. Research in this field has concentrated on oil and other fossil fuels (Hanneson, 2009) with little research focusing on the relationship between the renewable energy industry as a whole and wealth on an international scale. Menegaki (2011) published a paper empirically measuring the impact of gross domestic product (GDP) on renewable energy and greenhouse gas emissions in twenty-seven European countries between 1997-2007 but found no causal relationship. This paper only provided regional results, overlooking the relationship between these variables on a global scale.
This paper examines the impact of wealth on renewable energy generation on an international scale; results from the empirical tests provide global and local statistics. For the purpose of researching decade period changes, data were aggregated in to three-decade groups (1990s, 2000s, and 2010s). Data were compiled to see if a country’s GDP impacts the amount of renewable energy generated over a period of twenty-five years. Further testing was conducted to determine if a spatial relationship exists between the variables included in this study.
Current Issues in Renewable Energy Production
The growth in renewable energy production and consumption is due to geographic proximity to resources and the development of improved technologies for energy generation. In recent years, scholars have focused on wind, hydro, solar, and biofuel (biomass) (Timilsina, van Kooten, & Narbel, 2013). According to Prakash and Bhat (2009), as technology improves, the economic viability of wind, hydro, and other renewable power sources increases. In geographic locations where these power sources are not possible, solar power and biomass may work as potential substitutes. There is a competitive and marketable future for alternative fuel sources across the world.
Wind
The focus on wind energy is warranted due to the rise in wind farms across the developed world. Wind power generation is outpacing other forms of renewable energy due to improvements in technology and minimal costs associated with running the wind structures (Benitez, Benitez, & van Kooten, 2008). Governmental tax subsidies in more developed countries (MDCs) are largely responsible for the rise in wind farm construction in recent years. Europe has been at the forefront in the adoption of wind power through the use of tax subsidies and redistributive policies. According to Söderholm and Klaassen (2007), a “fixed feed-in price system” (p. 183) has promoted the adoption and promotion of wind power across Europe. However, this system can negatively impact more competitive forms of energy and overlooks the impact of location on wind power efficiency. The United States has also seen an upsurge in wind farm construction in recent years. Due to technological innovation, wind has increased in energy output and cost-effectiveness by as much as 80% in recent decades (DeCarolis & Keith, 2006).
The major problem associated with wind power is storage. Wind power efficiency is greatly reduced in areas without consist wind. At the point that wind stops, backup generators must take the place of the wind turbines as the source of energy. Scholars have proposed different ways of storing latent energy for later use, but most methods remain relatively inefficient and lose power during the process of storage (Belanger & Gagnon, 2002; Castronuovo & Lopez, 2004; Korpaas, Holen, & Hildrum, 2003). According to Benitez, Benitez, and van Kooten. (2008), storage costs get pushed onto the consumer and can count for as much as “15% to 30% of the investment cost” (p. 1987). This problem can be alleviated “if hydraulic storage is available, with electrical grids that are more dependent on hydropower better able to integrate intermittent wind and other such power sources” (p. 1988).
The shortfalls in wind power’s economic viability present an issue that should be met with the appropriate policy initiatives. In 2012, a total of 118 sovereign governments agreed to a set of renewable energy targets to be met by 2020. Each country has differing target initiatives with varying degrees of government programs designed to promote the use of renewable energy. These promotional efforts include, but are not limited to, tax subsidies, tradable energy certificates, and mandatory energy targets (REN21, 2012). Although plans have been made on behalf of wind energy promotion, Timilsina, van Kooten, and Narbel. (2013) argued that “wind power is still expensive as compared to most traditional technologies to generate electricity” (p. 651). However, the expense of wind power can be offset when considering the external costs associate with the burning of fossil fuels. Without considering externalities, wind remains an expensive alternative to petroleum and coal.
Hydropower
A growing interest in renewable energy sources has led to elevated attention being placed on hydropower infrastructure development (Bakken, et al., 2014; Yüksel, 2010). While some scholars consider hydropower to be an important and reasonable replacement for the use of fossil fuels, others have argued that the damage to local aquatic life and the ecological disruption caused by the construction of hydro plants causes irrevocable deterioration of surrounding environments (Bunn & Arthington, 2002; McCully, 1996; Rosenberg, Bodaly, & Usher, 1995). The growing debate over renewable energy and subsequent environmental impacts has rehashed old debates in the energy community over the environmental sustainability of hydropower (Fletcher, 2010).
While there continues to be a wide range of issues surrounding the use and implementation of hydropower as a renewable source, some scholars argue that hydropower offers a potential solution in countries that do not have the wealth to implement other forms of renewable energy (Kaygusuz, 2004; Yüksek, 2008). Dams offer a source of energy with minimal greenhouse gas emissions while helping to regulate flooding in surrounding settlements. Dams also help to improve surrounding irrigation as well as facilitate maritime shipping (Kaygusuz, 2009). According to Yüksek (2008), hydropower has the potential to offer wide-scale energy for lesser developed countries (LDCs) that otherwise could not afford the wholesale adoption of other renewable sources.
Dams produce energy using water but do not consume the fuel source, making it one of the most efficient power generators. Dams and connected power plants also provide local economies with skilled jobs. Some scholars argue that the positives outweigh the negatives (Freya & Linke, 2002; Rehman & Anis, 2008). The choice between the costs associated with hydropower and subsequent benefits is a difficult choice to make. According to Freya and Linke (2002),
“hydropower projects are often multi-purpose in nature, meeting multiple needs of society in areas such as flood control, assurance of a firm water supply, recreational benefits, as well as energy production. If the costs of acquiring those benefits include some changes in the natural environment, then the decision to move forward, or not, is a societal one based on a population’s value system” (p. 1265).
Using the Granger causality method, Bildirici and Gӧkmenoğlu (2017) concluded that the economic benefits and reduction of carbon dioxide emissions from the use of hydropower could greatly benefit G7 countries (Canada, France, Germany, Italy, Japan, the United Kingdom and the United States). The widespread use of hydropower could offer economic benefits to developing countries as well.
Solar
The economic viability of large-scale solar energy has come into question due to an inefficient energy storage mechanism. In recent years, however, solar energy has seen a rise in technological innovation and has attracted new investors. Scholars have estimated that by 2020, the United States could see an increase in solar energy generation by as much as 20 to 40 times current value (Lorenz, Pinner, & Seitz, 2008). This has been largely due to the development of concentrated solar power (CSP) technology, which stores thermal energy in tanks allowing the system to produce energy even when sun radiance is low. The CSP system has the potential to vastly improve affordability and efficiency of solar power on a large-scale network (Dowling, Zheng, & Zavala, 2017).
Although technological innovation has helped to reduce the cost of solar power, scholars have disagreed over appropriate policy measures. Some have argued that privatization will help to increase competition, thereby attracting new energy suppliers. This will bring about more choice for the consumer and promote the use of alternative forms of energy. Privatization along with tax subsidies promote productivity and provide market incentives (Peltzman, 1989; Vickers & Yarrow, 1988). Others argue that the energy market promotes the creation of monopolies due to the natural make-up of the energy network. To avoid the development of monopolies, governments should institute regulations that help to reduce prices and promote competition (Florio, 2013; Newbery, 2000).
The effects of government incentives and regulation programs may differ across time and location. According to Clò and D'Adamo (2015), solar energy prices in Italy saw a reduction during peak usage hours while remaining relatively stable during off-hours. The price variability between peak and off-peak hours were due to an increase in solar energy generation. This increase was due in large part to government incentives and market manipulations. Even though there is market uncertainty, scholars have continued to argue in favor of solar power production to combat the worldwide dependency on fossil fuels (Lorenz, Pinner, & Seitz, 2008).
Biomass
Biomass fuel production has increased in recent years, being used to power small towns in both MDCs and LDCs. More biomass is consumed per capita in LDCs due to its relatively cheap cost. (Radetzski, 1997). The production of biomass is a fairly simple process: industries take organic waste and convert it into liquid, solid, or gas fuel (Klass, 1998). Biomass is one of the only renewable energy sources that directly emits greenhouse gases. Scholars have argued that CO2 emitted during the burning of biomass is offset by the CO2 that was absorbed during the tenure of the plant cycle prior to composting. “For every 100 green tonnes of tree energy crop fuel used, 58 tonnes of CO2 emissions reduction occurs due to agriculture source carbon sequestration in the roots below ground” (Akella, Saini, & Sharma, 2009; p. 394).
Historically, biomass has been consumed on a local scale, only used to supplement daily household needs. Due in part because of a decrease in the supply of wood and the rise of coal, the 18th century saw a sharp decline in biomass consumption in Europe (Maurice & Smithson, 1984). The rise of biomass demand in the 1990s was sparked largely by environmental debates and concerns over the supply of petroleum on a global scale. Due to rising agricultural surpluses in developed countries, scholars have argued that the excess agriculture can be used to create biomass and be exported to developing countries as an alternative fuel source (Radetzki, 1997).
The main market mechanism that is keeping biomass from truly being competitive with fossil fuels is the conversion process. The raw materials used to create biomass (agricultural crops, wood, waste bio-products, aquatic plants, municipal solid waste, etcetera) can greatly affect the price and efficiency of the finished product. Caputo, Palumbo, Pelagagge, and Scacchia (2005) determined that biomass production can be profitable using modern techniques along with the support of tax incentives. There are extraneous impacts to the production and generation of biomass on a national scale as well. According to Bildirici (2016), “There is a unidirectional relationship from biomass energy consumption to GDP, which means that biomass energy consumption acts as a stimulus to economic growth” (p. 567). The production of biomass on a large-scale along with the development of sound infrastructure to ensure safe transportation has the potential to stimulate economic growth in developing countries across the globe.
Materials and Methods
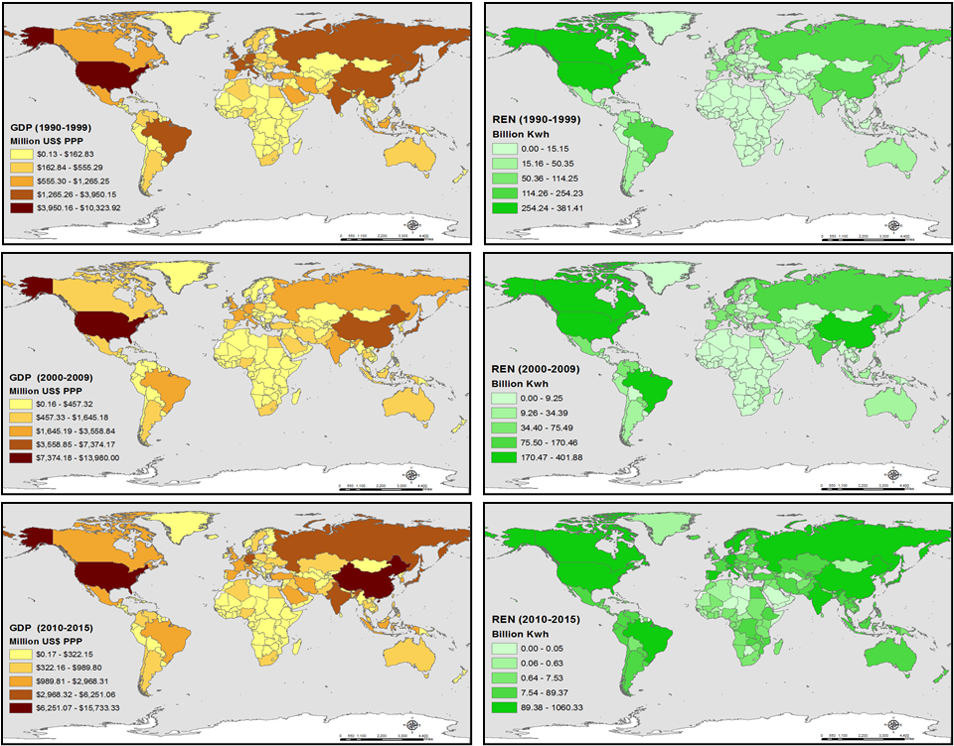
According to the CIA World Factbook (2017), there are currently 195 sovereign states and 72 dependent territories throughout the world. Due to limited data, 195 countries were included in this study (Figure 1). Data were collected from the US Energy Information Administration - National Energy Statistics (2017). All data included in this analysis were compiled from 1990 to 2015 demographics. Calculations were computed, analyzed and graphed using Microsoft Excel, version 1802, R Statistical Software, ArcMap 10.5.1, and GWR4 Semiparametric GWR/GWGL modelling software.
In order to examine the relationship between wealth and renewable energy, data were organized according to decade; bivariate ordinary linear regression (OLR) and geographically weighted regression (GWR) were performed on the mean values of each decade. Due to a lack of recent data, variables included in this study were as recent as 2015. Three-decade periods were measured to see the relationship between GDP purchasing power parity (PPP) and renewable energy generated in order to test changes over time. Renewable energy generated includes the following measured variables: hydro, geothermal, wind, tidal/wave, solar, and biomass.

The GDP PPP (in billion US $) and total renewable energy generated (in billion kilowatts-hours) were compiled from 1990 until 2015 and divided into the following periods: 1990-1999, 2000-2009, and 2010-2015. Once the data were compiled, the mean values for each period were used in the regression model sets. Data were aggregated into these specific groups in order to relate to people’s understanding of time (decade periods provide a cultural context to the topic discussed in this paper). Three separate regression models within the OLR model set (Model Set 1) were produced for each given period using the following formula:
y_i=a_0+∑_k〖a_kx_ik+ε_i 〗 (1)
where y_i represents renewable energy generation at location i, a_0 is the intercept, a_k is the slope, x_ik represents the ith observation of independent variable k (GDP), and ε_iis the error term at location i.
After the first regression model set was completed, GWR was performed to see the local relationships between renewable energy generation and GDP PPP. GWR4 software was used to perform these calculations and results were projected using ArcMap. The following formula was used to derive the results:
y_i=a_0 (u_i,v_i)+∑_k〖a_k (u_i,v_i ) x_ik+ε_i 〗 (2)
where (u_i,v_i ) are the coordinates of point i in space. Global linear regression only provides global analyses and results, making it impossible to study relationships on a local level.
According to Brunsdon, Fotheringham, and Charlton (1996), GWR extends the use of simple linear regression “by allowing local variations in rates of change so that the coefficients in the model rather than being global estimates are specific to a location i” (p. 284). GWR uses a kernel weighting process that weights the kernels using distance or neighbors (Brunsdon, Fotheringham, & Charlton, 1998; Fotheringham, Brunsdon, & Charlton, 1998). The traditional kernel weighted matrix in GWR is based on the following formula:
W_ij={( 1 if d_ij≤d@ 0 if d_ij>d)} i,j=1,2,…,n (3)
where W_ij is the weighted value of the distance between location i and j (d_ij). This weighted matrix does not consider discontinuity. For this reason, Fotheringham, Charlton, and Brunsdon (1997) argued that W should be calculated as a continuous function of d. This is known as the Gaussian function. The following matrix formula was used in this analysis so as to avoid weighted bias:
W_ij=exp(-βd_ij^2 ) i,j=1,2,…,n (4)
where β represents distance decay using a Gaussian distribution. As one location gets further away from the location being tested, the weight declines accordingly. The weights are based on a scale between 0 and 1, rather than being strictly numerated as 0 or 1. Once GWR was completed, each country received an individual r-squared value, predicted value, intercept, standard residual, as well as other variables that were locally observed. All necessary data were provided in maps. All models are discussed in more detail in the next section.
Results
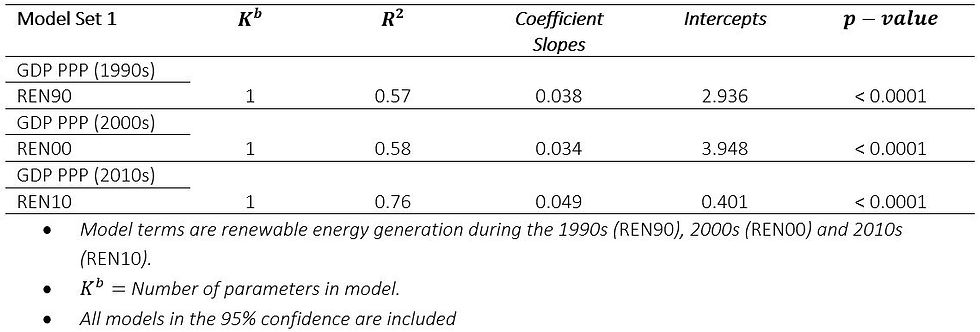
The first three separate global linear regression models were tested, collectively grouped together as Model Set 1, comparing GDP PPP in million US$ to the amount of renewable energy generated per billion kwh. Model 1 compared the mean values of both variables from 1990 to 1999. Results show a significant p-value< 0.0001 with an r^2=0.57. The slope coefficients (0.038) show a positive relationship between the two variables during the decade of the 1990s. Results from 2000 to 2009 (Model 2) show a significant p-value< 0.0001 and an r^2=0.58. The slope coefficients in Model 2 (0.034) show a positive relationship as well.
Model 3 compared the mean values for the two variables tested during the period of 2010 and 2015. Results in Model 3 showed a significant p-value< 0.0001 and an r^2=0.76. The coefficient estimates in Model 3 (0.049) show a positive relationship with the highest magnitude of the three global linear regression models tested. Model 3 had the most significant results in all areas of the three separate regression models (Table 1).
Table 1
Model Averaged Parameter Estimates of Wealth and Renewable Energy Generation, from 195 Countries, 1990-2015. Original global linear regression model set shown here (source: U.S. Energy Information Administration - International Energy Statistics, 2017. Generated using R Statistical Software).
The following formulae represents the results for the global linear regression models:
Renewable Energy Generation (1990-1999): ŷ=2.936+0.038x (5)
Renewable Energy Generation (2000-2009): ŷ=3.948+0.034x (6)
Renewable Energy Generation (2010-2015): ŷ=0.401+0.049x (7)
Between 1990 and 1999, the ordinary linear regression model set results show that as GDP PPP increases by $1 million US, renewable energy generation increases by 0.038 billion kwh. During the period of 2000 and 2009, as GDP PPP increases by the same amount, renewable energy generation increases by 0.034 billion kwh. Between 2010 and 2015, for an increase in $1 million US, there is an increase in renewable energy generation of 0.049 billion kwh. The increase in the intercept coefficient between each model reflects a growing trend in renewable energy production worldwide.
After the ordinary linear regression results were derived, GWR was administered to determine the local relationship between renewable energy generation and GDP PPP. Global regression and spatially weighted regression provide an overview of the linear and spatial relationship respectively, however, they do provide a description of the local relationships. This model set was collectively titled Model Set 3. GWR also calculated global statistics derived from the local results (Table 2). GWR global statistics show an r^2=0.95 for 1990-1999, an r^2=0.96 for 2000-2009, and an r^2=0.98 for 2010-2015. These results are much more significant than the previous global regression model sets and show that over time, more variability can be explained in the models. Model Set 2 explains more of the variability than both previously calculated regression models.
Table 2
Model Averaged Parameter Estimates of Wealth and Renewable Energy Generation, from 195 Countries, 1990-2015. Geographically weighted regression model set shown here (source: U.S. Energy Information Administration - International Energy Statistics, 2017. Generated using GWR4)
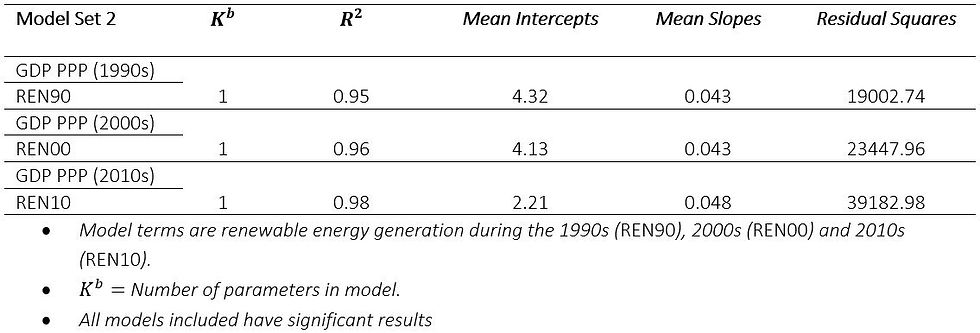
It is important to note the ranges in the model terms within the GWR results. The mean coefficient estimate provides an overview of the global averages of each local model but does not evaluate the validity of the GWR model set as compared to the global regression model set (Model Set 1). For this reason, the range of the coefficients provide rationale for the use of GWR over ordinary linear regression and spatially weighted regression. If the ranges are low, the GWR does not explain the relationship any better than global regression. If the range is high, spatial non-stationarity is present and GWR provides a better explanation of the relationship between wealth and renewable energy generation.
Ranges present in the variable coefficient estimates, intercepts, and R^2 values vary from one another yet show enough difference to warrant a closer look. The range for the variable coefficient slopes during the period of 1990-1999 was 0.2298, during 2000-2009 it was 0.172, and during 2010-2015 it was 0.1604. These range values are seemingly low, however the original values of the coefficient slopes were low as well. The range for the intercepts during the period of 1990-1999 was 346.93, during 2000-2009 it was 373.50, and during 2010-2015 it was 437.85. The range between the high and low R^2 values during the period of 1990-1999 was 0.874, during 2000-2009 is was 0.882, and during 2010-2015 it was 0.931 (Table 3).
Table 3
Model Averaged Parameter Estimate ranges between high and low values are shown here (source: U.S. Energy Information Administration - International Energy Statistics, 2017. Generated using GWR4)

The high range values present for each statistic shows evidence of spatial nonstationarity, providing the rationale for the use of the GWR model as the best explanation for the relationship between GDP PPP and renewable energy generation. Local results show some interesting regional changes in the global generation of renewable energy and its relationship with wealth.
During the period of 1990-1999, countries with an r^2 between 0.649 and 0.997 appear in North America, South America, Asia, and Australia/New Zealand, while r^2 results on the lower end of the spectrum (r^2 between 0.123 and 0.298) were few and far between; located in Southern Africa, Eastern Africa, Eastern Europe, and Northern Europe. Countries in Western Europe, Central Europe, North Africa and the Middle East remained in the middle r^2 values (r^2 between 0.299 and 0.648).

The period of 2000-2009 kept the same distribution with mild increases in r^2 values in Europe, North Africa, and the Middle East. A similar increase in r^2 values happened in the final period analyzed. During the period of 2010-2015, several countries around the Mediterranean Sea saw an increase of r^2 values to between 0.813 and 0.998 (figure 2). These results show a dramatic increase in the relationship between wealth and renewable energy production regionally and globally.
Local coefficient slope results show that GDP has a much stronger impact on renewable energy generation in South America than any other region in the world. This remains prevalent throughout the three-decade periods studied. The slope in East Asia, Russia and New Zealand saw a consistent increase throughout the three-decade periods. Europe and North Africa also saw a consistent rise in slop values throughout each decade periods.
Discussion
Linear regression results from Model Set 1 show that GDP PPP significantly impacts renewable energy generation on a country scale. All three models show a positive linear relationship that improved over time. These results suggest that over a period of 25 years, developed countries have generated more renewable energy while developing countries are continuing to generate minimal amounts of renewable energy. These results also suggest that throughout that period, renewable energy production has become more connected as time progressed. This reflects a growing divide in the renewable energy market between the core and periphery world. The r^2 results show that as time continued, the variables tested explain more of the variation and provide a good explanation of the results.
Results from the GWR model (Model Set 2) show that the local relationship between wealth and renewable energy generation show spatial non-stationarity; a different reality than was shown in both the simple linear regression and spatially weighted regression model sets. This relationship was evenly spread and remained significant across the map throughout the first two periods in this study, with a few outliers in Eastern Europe, Northern Europe, Southern Africa, and Eastern Africa.
The major spatial change occurred in the period of 2010-2015, where countries surrounding the Mediterranean Sea saw a dramatic increase in significance. This gradual increase in explanatory power around the Mediterranean shows that, while wealth has increased, these countries have continued to produce more renewables energy. While Mediterranean renewable energy generation and wealth have increased, the relationship between these variables in Southern and Eastern Africa has remained insignificant. There has been an increase in renewable energy generation in Sub-Saharan Africa but GDP PPP has remained low.
Statistical analyses performed here show an evolving relationship between wealth and renewable energy production both globally and locally. GDP PPP and renewable energy generation is growing across the globe (Figure 3), but at different rates across each region. Results presented here show that GDP PPP significantly impacts renewable energy generation and regional dynamics of this relationship are changing.
Conclusion
Four separate model sets were calculated to see if there is a link between renewable energy generation and GDP PPP. Results show that there is a significant relationship between these variables and it has been increasingly linked together on a global scale. However, results from this study present a much different reality on a local scale. While renewable energy and wealth are becoming more intertwined on the global scale, regional change is underway. The Mediterranean region has seen a dramatic growth in both renewable energy generation and wealth. Unfortunately, while countries in Southern and Eastern Africa have considerably increased renewable energy generation, they still remain poor. This decoupling of renewable energy generation and wealth may be due to new United Nations sustainability goals as well as increasing foreign aid from wealthy renewable energy producing countries.
Both global and local results provide valuable insight on the realities of renewable energy generation on an international scale. Sovacool (2008) argued that the economic viability of renewable energy is not due to cost or effectiveness but based on political biases. While this may be true, the link between wealth and the amount of renewable energy generated shows that between the years of this study there has been a growing relationship between these variables. Within the confines of this study the wealthiest countries are generating more renewable energy every decade while the poorest countries remain at the bottom. This study does not show that this gap is related to cost, however, it may be a variable that effects the distribution of renewable energy production.
The growing relationship between wealth and renewable energy may be due to several factors relating to both cost and policy. The largest cost associated with the wholesale adoption of renewable energy is infrastructure change. This cost alone can outweigh the economic benefits of renewable energy. Some scholars have argued that any attempt to promote renewable energy “by taxing, trading, regulating, reducing, or replacing greenhouse-gas emissions will prove cost effective solely on grounds of the welfare benefit foreseeable from global-warming mitigation alone” (Monckton, 2016; p. 185).
The success of renewable energy depends on the creation of cost-effective means for infrastructure development. If the cost of initial construction is removed from consideration and renewable energy were subsidized at the same level as fossil fuels in developed countries, the move from current energy sources to renewable sources would be economical. Scholars have insisted that wealthier societies can afford to make this jump with relative ease. “Historical precedent strongly suggests that affluent societies can function satisfactorily at rather higher prices. If, in real terms, the price of electricity goes no higher than three-fold the current price, the world’s economies should be relatively unscathed” (Pickard, 2012; p. 353).
While wealthier countries will continue to diversify their energy generation, there is still the issue of developing countries and their energy production. This study suggests that there is a growing trend in renewable energy generation internationally; however, some countries are being left out. Developed countries should continue working to diversify the energy sector in order to stay competitive, and work alongside developing countries to ensure that all people have relatively cheap access to renewable electricity. This can be achieved by the development of trade deals that promote the export of biofuel sources from one country to the next.
Developed countries should view developing countries not as competitors but partners in global trade and energy production. Trade agreements should be structured so that both countries benefit from the use of cleaner energy. The profit made from these agreements, along with the reduction in trade-deficits, could benefit both parties. Trade deals could also stimulate foreign aid issuances for clean and renewable energy produced in developing countries. As technology improves, production cost and prices will continue to fall as well. This should be assisted with positive domestic and foreign policy that leads to a reduction in prices and a coherent strategy of global interaction.
References
Akella, A., Saini, R., & Sharma, M. (2009). Social, economical and environmental impacts of renewable energy systems. Renewable Energy, 34(2), 390-396. doi:10.1016/j.renene.2008.05.002
Anselin, L. (1988). Model validation in spatial econometrics: a review and evaluation of alternative approaches. International Regional Science Review, 11(3), 279-316.
Bakken, T. H., Aase, A. G., Hagen, D., Sundt, H., Barton, D. N., & Lujala, P. (2014). Demonstrating a new framework for the comparison of environmental impacts from small-and large-scale hydropower and wind power projects. Journal of Environmental Management, 140, 93-101.
Bélanger, C., & Gagnon, L. (2002). Adding wind energy to hydropower. Energy Policy, 30(14), 1279-1284.
Benitez, L. E., Benitez, P. C., & van Kooten, G. C. (2008). The economics of wind power with energy storage. Energy Economics, 30, 1973-1989. doi:10.1016/j.eneco.2007.01.017
Bildirici, M. E. (2016). Biomass energy consumption and economic growth: ARDL analysis. Energy Sources, Part B: Economics, Planning, and Policy, 11(6), 562-568. doi:10.1080/15567249.2011.649101
Bildirici, M. E., & Gökmenoğlu, S. M. (2017). Environmental pollution, hydropower energy consumption and economic growth: Evidence from G7 countries. Renewable and Sustainable Energy Reviews, 75, 68-85. doi:10.1016/j.rser.2016.10.052
Brunsdon, C., Fotheringham, A. S., & Charlton, M. E. (1996). Geographically weighted regression: a method for exploring spatial nonstationarity. Geographical analysis, 28(4), 281-298.
Brunsdon, C., Fotheringham, S., & Charlton, M. (1998). Geographically weighted regression. Journal of the Royal Statistical Society: Series D (The Statistician), 47(3), 431-443.
Bunn SE & Arthington AH. (2002). Basic principles and ecological consequences of altered flow regimes for aquatic biodiversity. Environmental Management 30(4), 492–507. doi:10.1007/s00267-002-2737-0 PubMed: 12481916.
Caputo, A. C., Palumbo, M., Pelagagge, P. M., & Scacchia, F. (2005). Economics of biomass energy utilization in combustion and gasification plants: effects of logistic variables. Biomass and Bioenergy,28(1), 35-51. doi:10.1016/j.biombioe.2004.04.009
Castronuovo, E. D., & Lopes, J. A. P. (2004). Optimal operation and hydro storage sizing of a wind–hydro power plant. International Journal of Electrical Power & Energy Systems, 26(10), 771-778.
Clò, S., & Dadamo, G. (2015). The dark side of the sun: How solar power production affects the market value of solar and gas sources. Energy Economics, 49, 523-530. doi:10.1016/j.eneco.2015.03.025
Decarolis, J. F., & Keith, D. W. (2006). The economics of large-scale wind power in a carbon constrained world. Energy Policy, 34(4), 395-410. doi:10.1016/j.enpol.2004.06.007
Dowling, A. W., Zheng, T., & Zavala, V. M. (2017). Economic assessment of concentrated solar power technologies: A review. Renewable and Sustainable Energy Reviews, 72, 1019-1032. doi:10.1016/j.rser.2017.01.006
Edenhofer, O., Hirth, L., Knopf, B., Pahle, M., Schlömer, S., Schmid, E., & Ueckerdt, F. (2013). On the economics of renewable energy sources. Energy Economics,40(S1), 12-33. doi:dx.doi.org/10.1016/j.eneco.2013.09.015
Finn, M. G. (2000). Perfect competition and the effects of energy price increases on economic activity. Journal of Money, Credit, and Banking, 32(3), 400-416.
Fiorio, C. V., & Florio, M. (2013). Electricity prices and public ownership: Evidence from the EU15 over thirty years. Energy Economics, 39, 222-232. doi:10.1016/j.eneco.2013.05.005
Fletcher R. (2010). When environmental issues collide: Climate change and the shifting political ecology of hydroelectric power. Peace and Conflict Review 5(1), 14–30.
Florio, M. (2013). Network industries and social welfare: the experiment that reshuffled European utilities. Oxford: Oxford University Press.
Fotheringham, A. S., Charlton, M. E., & Brunsdon, C. (1998). Geographically weighted regression: a natural evolution of the expansion method for spatial data analysis. Environment and Planning A, 30(11), 1905-1927.
Fotheringham, A. S., Charlton, M., & Brunsdon, C. (1997). Two techniques for exploring non-stationarity in geographical data. Geographical Systems, 4(1), 59-82.
Freya, G. W., & Linke, D. M. (2002). Hydropower as a renewable and sustainable energy resource meeting global energy challenges in a reasonable way. Energy Policy, 30(14), 1261-1265.
Greene, D. L. (1997). Economic scarcity: forget geology, beware monopoly. Harvard International Review, 19, 3, 16-19.
Hannesson, R. (2009). Energy and GDP growth. International Journal of Energy Sector Management,3(2), 157-170. doi:10.1108/17506220910970560
Kaygusuz, K. (2004). Hydropower and World’s energy future. Energy Sources, 26, 215-224.
Kaygusuz, K. (2009). The role of hydropower for sustainable energy development. Energy Source, Part B,4(4), 365-376. doi:10.1080/15567240701756889
Klass, D. L. (1998). Energy consumption, reserves, depletion, and environmental issues. In Biomass for renewable energy, fuels, and chemicals (pp. 1-27). San Diego, CA: Academic Press.
Korpaas, M., Holen, A. T., & Hildrum, R. (2003). Operation and sizing of energy storage for wind power plants in a market system. International Journal of Electrical Power & Energy Systems, 25(8), 599-606.
Lorenz, P., Pinner, D., & Seitz, T. (2008). The economics of solar power. The McKinsey Quarterly, 4, 66-78.
Luft, G. (2013). Kill the oil monopoly. Foreign Policy, 198, 58-59.
Maurice, S. C., & Smithson, C. W. (1984). The doomsday myth: 10,000 years of economic crises. Stanford, CA: Hoover Institution Press, Stanford University.
McCully, P. (1996). Silenced rivers: The ecology and politics of large dams. London, UK: Zed Books.
Menegaki, A. N. (2011). Growth and renewable energy in Europe: a random effect model with evidence for neutrality hypothesis. Energy Economics, 33(2), 257-263.
Monckton, C. (2016). Is CO2 mitigation cost effective? In D. Easterbrook (Ed.), Evidence-based climate science: Data opposing CO2 emissions as the primary source of global warming (Vol. 2, pp. 175-187). Amsterdam: Elsevier.
Mork, K. A. (1989). Oil and the macroeconomy when prices go up and down: An extension of Hamilton’s results. Journal of Political Economy, 97(3), 740-744. doi:10.1086/261625
Nesta, L., Vona, F., & Nicolli, F. (2014). Environmental policies, competition and innovation in renewable energy. Journal of Environmental Economics and Management, 67(3), 396-411. doi:10.1016/j.jeem.2014.01.001
Newberry, D. M. (2002). Privatization, restructuring, and regulation of network utilities. Cambridge, MA: Massachusetts Institute of Technology.
O’Sullivan, D., & Unwin, D. (2010). Geographic information analysis (Second ed.). Hoboken, NJ: Wiley & Sons.
Owen, A. D. (2004). Environmental externalities, market distortions and the economics of renewable energy technologies. The Energy Journal, 25(3), 127-156. doi:10.5547/issn0195-6574-ej-vol25-no3-7
Peltzman, S. (1989). The economic theory of regulation after a decade of deregulation. Brookings Papers on Economic Activity, Vol. 1989, 1-59.
Pickard, W. F. (2012). Where renewable electricity is concerned, how costly is “too costly”? Energy Policy,49, 346-354. doi:10.1016/j.enpol.2012.06.036
Radetzki, M. (1997). The economics of biomass in industrialized countries: An overview. Energy Policy, 25(6), 545-554.
Rehman, A., & Anis, H. (2008). Impact of hydropower projects on economic growth of AJK (pp. 1-24, MPRA Paper No. 13070). Muzaffarabad: International Institute of Islamic Economics.
REN21 (2012). Renewables 2012 global status report (Paris: REN21 Secretariat). Retrieved from (http://www.ren21.net/Portals/0/documents/activities/gsr/GSR2012_low%20res_ FINAL. pdf), January 01, 2018.
Rosenberg, D., Bodaly, R., & Usher, P. (1995). Environmental and social impacts of large scale hydroelectric development: Who is listening? Global Environmental Change, 5(2), 127-148. doi:10.1016/0959-3780(95)00018-j
Rotemberg, J., & Woodford, M. (1996). Imperfect competition and the effects of energy price increases on economic activity. Journal of Money, Credit, and Banking, 28, 549-577. doi:10.3386/w5634
Sanyal, P., & Ghosh, S. (2013). Product market competition and upstream innovation: Evidence from the U.S. electricity market deregulation. Review of Economics and Statistics, 95(1), 237-254. doi:10.1162/rest_a_00255
Söderholm, P., & Klaassen, G. (2007). Wind power in Europe: A simultaneous innovation–diffusion model. Environmental and resource economics, 36(2), 163-190. doi:10.1007/s10640-006-9025-z
Sovacool, B. K. (2008). Renewable energy: Economically sound, politically difficult. The Electricity Journal, 21(5), 18-29. doi:10.1016/j.tej.2008.05.009
The World Factbook. (2017). Washington, DC: Central Intelligence Agency, Retrieved February 19, 2018, from https://www.cia.gov/library/publications/the-world-factbook/index.html
Timilsina, G. R., van Kooten, G. C., & Narbel, P. A. (2013). Global wind power development: Economics and policies. Energy Policy, 61, 642-652. doi:10.1016/j.enpol.2013.06.062
U.S. Energy Information Administration - International Energy Statistics. (2017). Retrieved January 26, 2018, from https://www.eia.gov/beta/international/?src=-f3
Prakash, R., & Bhat, I. K. (2009). Energy, economics and environmental impacts of renewable energy systems. Renewable and sustainable energy reviews, 13(9), 2716-2721. doi:10.1016/j.rser.2009.05.007
Vickers, J., & Yarrow, G. K. (1988). Privatization: An economic analysis (Vol. 18). Cambridge, MA: MIT press.
Yüksek, Ӧ (2008). Reevaluation of Turkey’s hydropower potential and electric energy demand. Energy Policy, 36(9), 3374-3382. doi:10.1016/j.enpol.2008.05.004
Yüksel, I. (2010). Hydropower for sustainable water and energy development. Renewable and Sustainable Energy Reviews, 14(1), 462-469. doi:10.1016/j.rser.2009.07.025

Comments